Case Study · 2026 · Open source
churnpilot
A churn-and-retention copilot for data scientists. It puts AI and modern ML to work on customer data without trading away rigor or control. An agent proposes and explains each step; the data scientist stays in charge of every call. A deterministic, unit-tested Python core owns every number. And once you have run a randomized offer test, a causal layer targets the customers an offer will actually change, not just the highest-risk ones.
- Role
- Solo: design & build
- Stack
- Python 3.11 · pandas / NumPy · scikit-learn / XGBoost · Pydantic · Claude
- Evidences
- Rigor: causal effect, scored on ground truthAI: agent proposes, the DS decides
- more net value kept (simulated A/B)
- +72%more net value kept (simulated A/B)
- “sleeping dogs” contacted
- 260 → 72“sleeping dogs” contacted
- Postgres, SQLite or a file
- Any tablePostgres, SQLite or a file
- tests behind every number
- 168tests behind every number
Problem
An accurate churn model can still aim at the wrong people.
Churn models are unusually easy to ship broken. A feature that leaks the future. A drift nobody caught. A “probability” that isn’t really a probability. It looks great in the notebook and quietly collapses in production. Silently, because the same number keeps coming out.
And even a perfect risk score answers the wrong question. It tells you who is likely to leave, not who you can keep. Your highest-risk customer may be a lost cause who churns regardless, or a “sleeping dog” who churns because you contacted them. Spend by risk and you pay for both.
Why I built it
A power tool for the data scientist. Not a black box.
AutoML hides the decisions that matter. A blank notebook makes you rebuild the same leakage-safe scaffolding every time. churnpilot sits in between, built for data scientists who want AI on their churn data without trading away rigor or control.
The agent does the judgment work: reading the data, flagging a leaky feature, recommending a model, explaining a result. The data scientist stays in charge of every call. The agent proposes and narrates. It never quietly decides.
The point is to make the careful workflow the fast one, so rigor and speed stop being a trade.
How it works
The agent judges. Tested code computes. Artifacts remember.
A unit-tested Python CLI owns every number. You can’t unit-test a vibe. You can unit-test that PSI (the standard score for “has this data shifted?”) comes out at exactly zero for two identical distributions. Same input, same output, always.
Typed artifacts run between the two. Each step writes a schema-validated file stamped with a content hash of its parent, so you can always answer “what data produced this model?”
It runs on your data. Point one churn.yaml at your table (Postgres, SQLite or a file; panel or single snapshot) and the risk pipeline runs as-is. The causal layer further down needs one thing ordinary churn data doesn’t carry, a randomized offer test, and churnpilot checks for it and tells you which of the two you can run. The synthetic generator exists only so the tool can be tested and demoed with no PII. Every number below is synthetic and seeded; nothing about the tool is.
Architecture
Two roles, a tested seam, a paper trail.
┌─────────────────────────┐        ┌────────────────────────────┐
│ AGENT · the LLM         │        │ CLI · deterministic Python │
│ • explores & interprets │        │ • generate / split / fit / │
│ • flags leakage & drift │ calls →│ • score / measure          │
│ • recommends & explains │ ← reads│ • same input → same output │
│ • the DS decides        │        │ • unit-tested, seeded      │
└─────────────────────────┘        └────────────────────────────┘
   │  typed artifacts · schema + parent_sha256 lineage      │
   └────────────────────────────────────────────────────────┘
The agent proposes and explains. The CLI computes and never guesses. Typed artifacts (split-manifest, model-card, eval-report, drift-report and more) carry a parent_sha256 link between every step, so any result traces back to the exact data behind it.
Everything below comes from one run on one synthetic dataset: 8,000 subscribers, 24 months, ~8% monthly churn.
The model
A menu of models, ranked the honest way.
churnpilot doesn’t bet on one algorithm. It fits a whole menu (L1 logistic, a pruned tree, random forest, XGBoost), each in the same leakage-safe pipeline, with preprocessing fit on training data only.
Then it scores each on held-out data, never in-sample, and reports a stability check right beside the score: how much AUC the model gives up from train to holdout, and whether its score distribution drifted. Ranking is by held-out AUC. The recommendation is not. churnpilot proposes the steadiest model and names the higher-scoring one it passed over. Every model it trains is also measured against a coin-flip floor, so “better than nothing” stays on the record.
On this run it put L1 logistic first (held-out AUC 0.694, train-to-holdout drop +0.009) and flagged random forest and XGBoost unstable, at drops of +0.18 and +0.11 against a 0.05 bar. Its recommendation was to ship logistic.
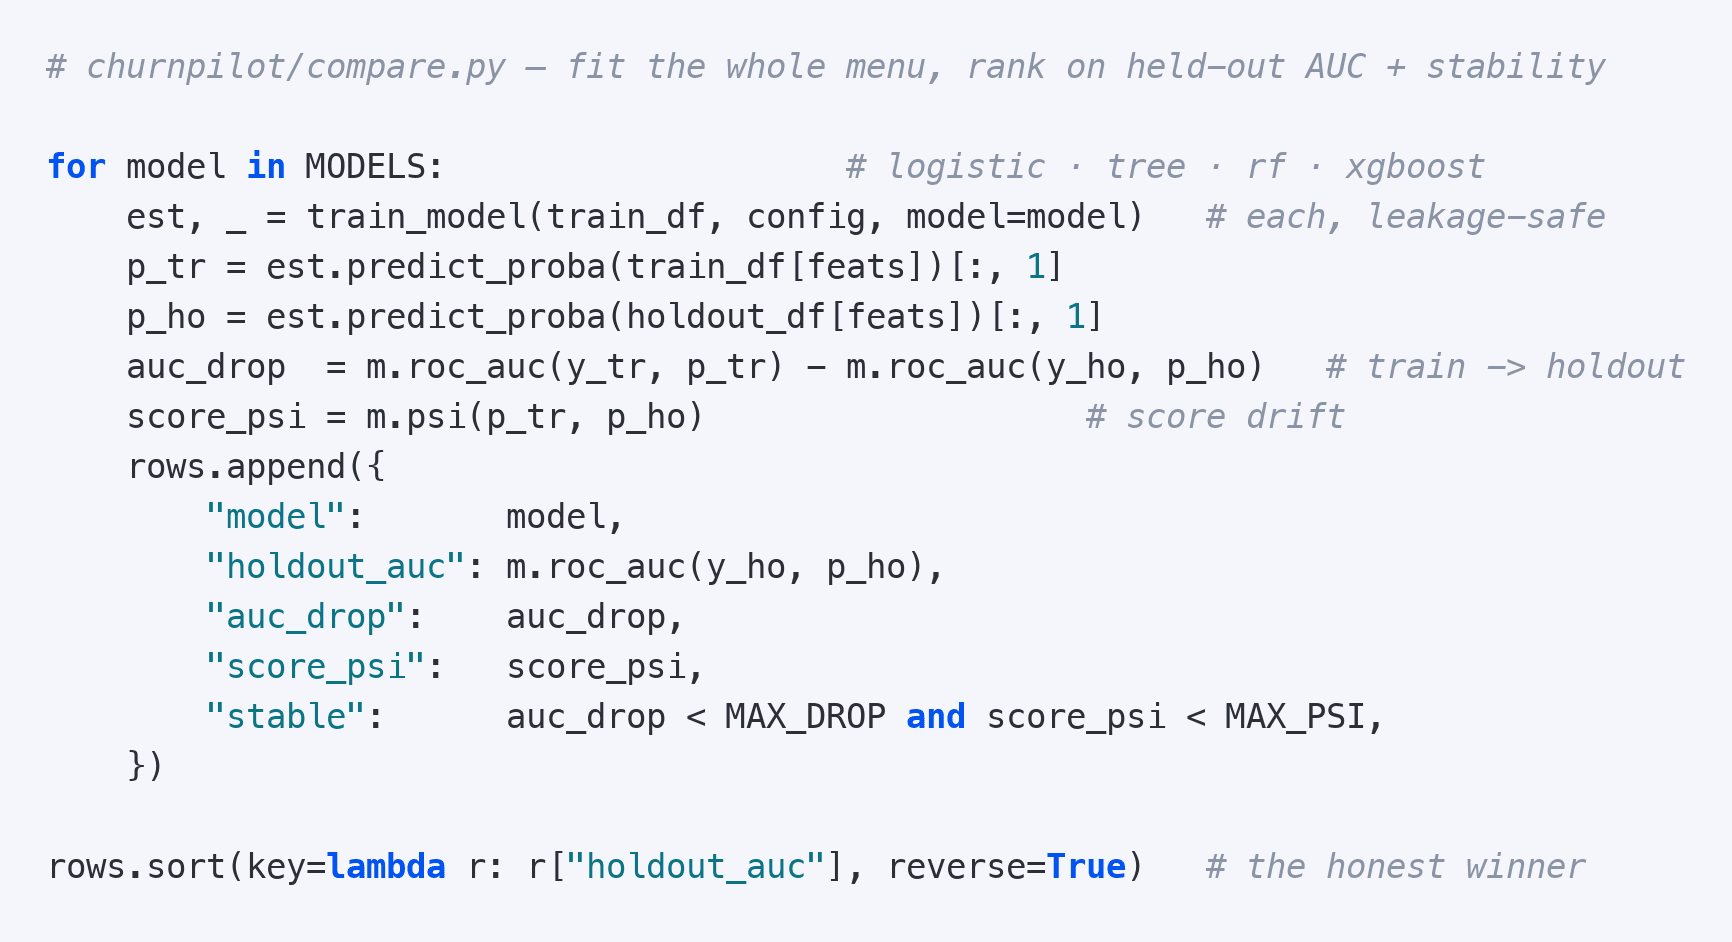
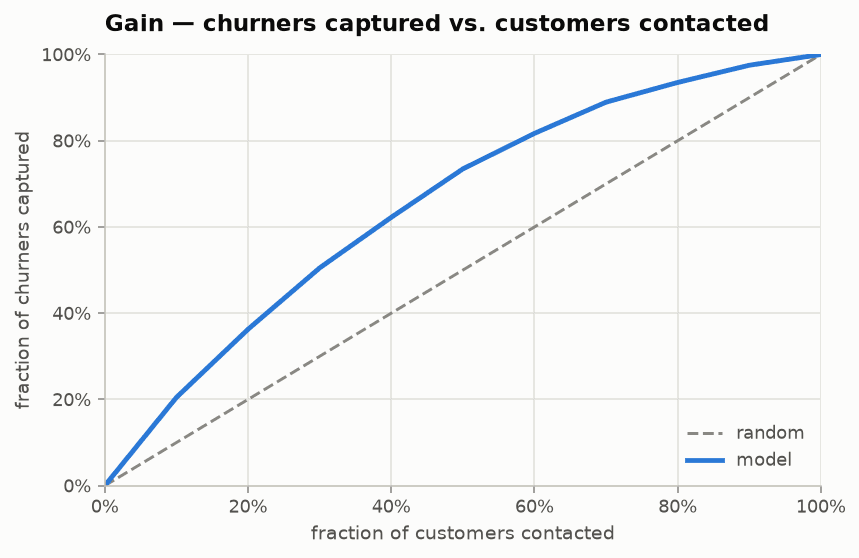
compare fits the four-model menu, scores each on a held-out set, and sorts by held-out AUC, carrying a stability flag (train→holdout AUC drop + score drift) so a model that leads on score alone can’t hide that it overfit.The held-out figures below are XGBoost’s, the model this run carried through evaluation and into the policy work. On the test split it lands an AUC ≈ 0.67 with a top-decile lift of ~2× (the riskiest tenth of customers churn at about twice the base rate). A normal, useful churn model, not a suspiciously perfect one, and still one the stability check argues you out of shipping. The gain curve is what it looks like: contact the top-scored tenth and you catch about a fifth of churners; the top half captures roughly three-quarters.
The result that matters
Target persuadables, not just risk.
So churnpilot asks a better question. Not “who will churn?” but “who will we change?”
Answering it takes an experiment. The method is a T-learner: fit one model on customers who got an offer, one on those who didn’t. The gap between them is the causal effect of the offer. That holds only if who got the offer was decided at random, so this layer needs a treatment/control column, not just history. advise checks whether your data has one and says which pipeline applies: risk only, or risk plus uplift. Everything below runs on a simulated A/B test.
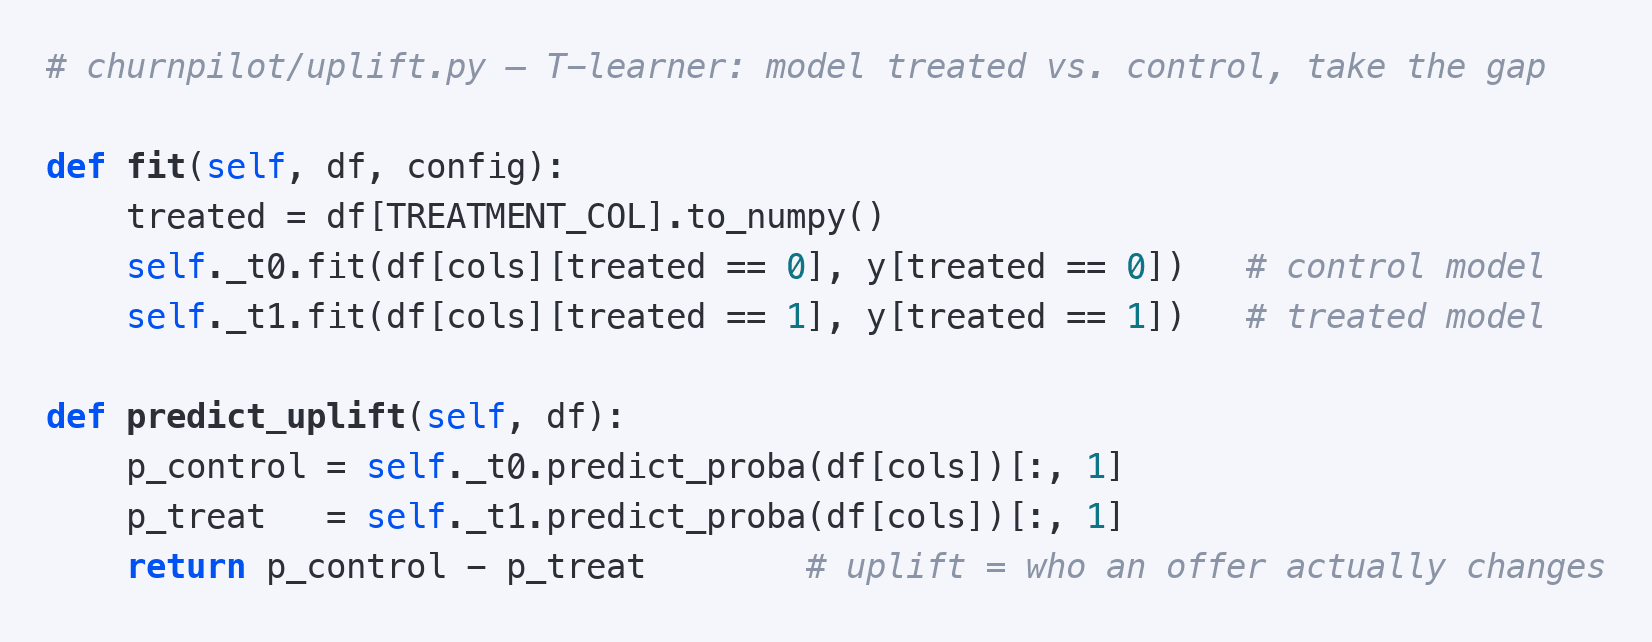
predict_uplift returns P(churn | no offer) − P(churn | offer): how much an offer moves each customer. Rank by that, not by risk, and you spend the budget on the people you can actually keep.On the held-out split it recovers the true treatment effect at correlation ≈ 0.38, measured against data the model never saw, not the rows it trained on.
Its ranking also clears the random baseline on a Qini curve, which scores an uplift model’s targeting the way AUC scores a risk model. Work down the predicted-uplift list and you win more retentions per offer than chance.
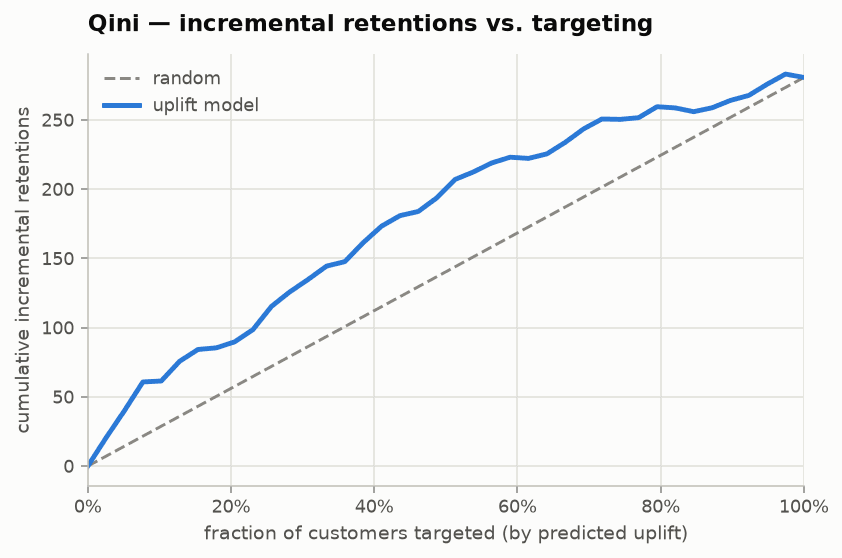
The payoff shows up when you spend the same budget both ways and score each against the true counterfactual. That is honest only because the generator knows every customer’s treated and untreated outcome. On real data you could never measure it. One run, 1,500 offers, $4,500:
| Target by risk | Target by uplift | |
|---|---|---|
| True value kept | $17,509 | $26,877 |
| Net value (after $4,500 spend) | $13,009 | $22,377 |
| Return on the retention spend | 3.9× | 6.0× |
| “Sleeping dogs” contacted | 260 | 72 |
Same spend. Uplift keeps 54% more true value, and 72% more once the offer cost comes out, while contacting just over a quarter as many “sleeping dogs”, the customers an offer only pushes toward the door. Exact figures move with the seed; the direction is the point.
That gap is the decision-science difference between “who’s at risk?” and “who will we actually change?”
What you get
One command away, on your own data.
churnpilot ships as an open-source CLI plus the agent that drives it. One churn.yaml runs the whole pipeline: generate, validate, profile, split, train, compare, evaluate, simulate-policy, report, monitor, and the uplift layer. Every step emits a typed, lineage-stamped artifact and a shareable HTML report.
It runs on any churn dataset: Postgres, SQLite or a file. The synthetic data here is only so you can try the whole thing end to end with nothing to install but the tool.
Engineering rigor
What makes the numbers trustworthy.
- Clean-room metric core. Decile-table KS, PSI with frozen reference edges, gain/lift, ROC/PR-AUC, log-loss and calibration, all hand-implemented in numpy/pandas rather than imported, and unit-tested.
- Leakage, made teachable. A planted leakage feature the profiler flags at +0.92 correlation, and a leakage-guarded split that detects the classic panel-data entity leak instead of hiding it.
- Typed, validated artifacts with
parent_sha256lineage, behind 168 passing tests. The numbers are covered by tests, not trust. - Config-driven and domain-agnostic. Runs on any churn dataset from one
churn.yaml; drift and time features degrade gracefully when there’s no date column.
Go deeper